
We deliver
spatial intelligence
Spatial intelligence is the ability to reason about the physical world as it exists and evolves in space and time
Geolava
World Model
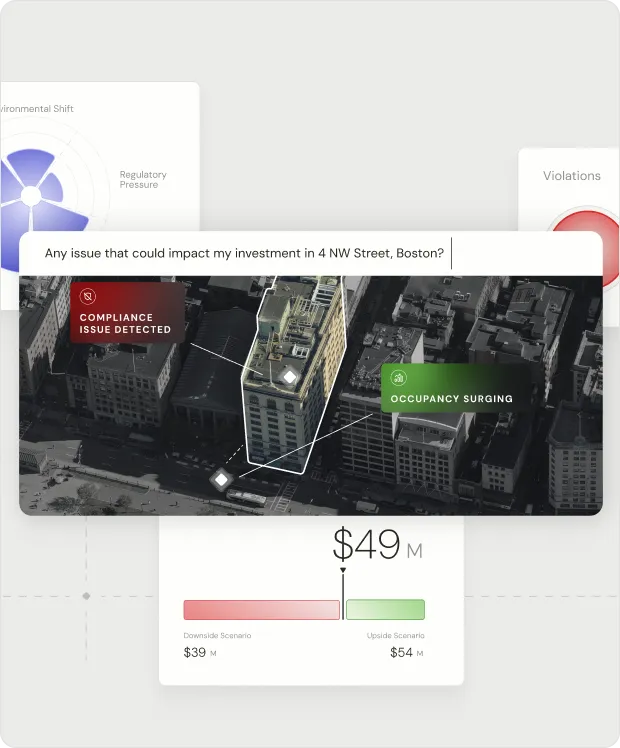
Our model transforms seeing into reasoning. It simulates real world actions to predict future states and uncover hidden exposure and opportunities


Uncover risks, capex drivers, and property signals in real time — no complex tools or manual analysis needed.
Anticipate future risks, impacts, and opportunities—so you can plan with confidence before they materialize.
Stay ahead with continuous monitoring—track changes, flag risks, and protect performance in real time.

Our Spatial AI Models

scenarios
drivers

infrastructure
Where can I unlock the most NOI growth for this property?
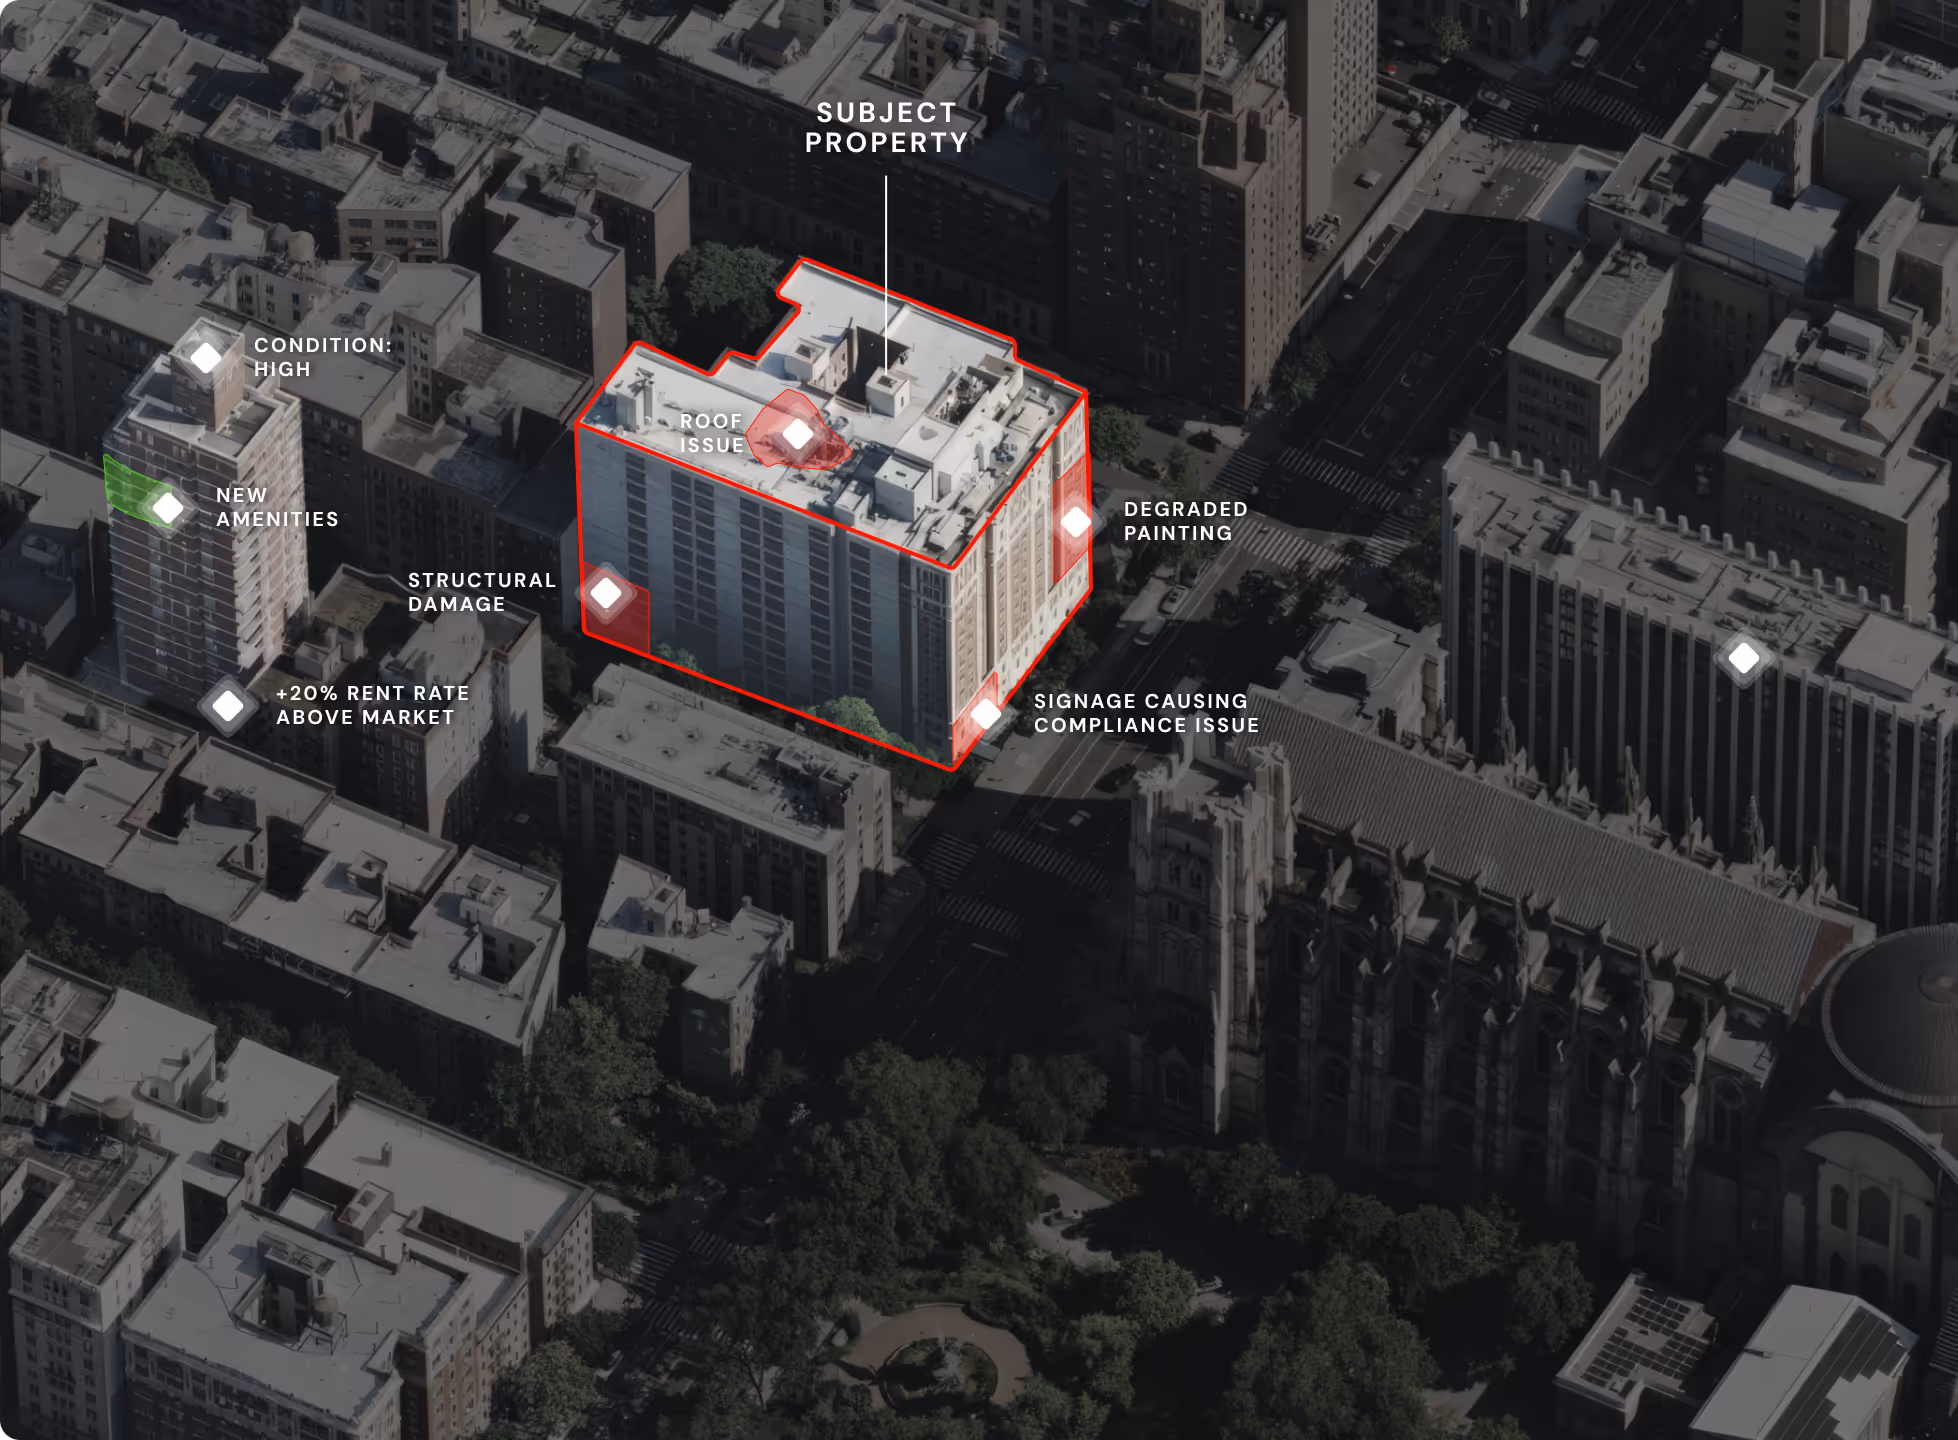


Underperforming Asset
Physical condition lags peers (roof leaks). Upgraded assets achieve 18–25% higher retention → risk of 12–20% lower renewals and rising capex.
The asset underperforms upgraded buildings within 300 m (rents are 12–20% higher). Outdated layouts limit returns; targeted upgrades can add 10–18% NOI.


Value Potential
Office demand is fragmenting within submarkets, not declining uniformly. Buildings within 300m of mixed-use nodes are holding foot traffic while adjacent assets are quietly losing it.
Tenant renewal probability drops 22% in buildings outside high-amenity clusters. Operating costs are rising faster in isolated assets.


Flood-exposed assets
Insurance costs up 15–25% within 12–24 months. Low-elevation assets face 12–20% higher value volatility and refinancing pressure.

Mortgage demand up 10–18% near growing residential density and redevelopment zones. Higher elevation and stable infrastructure drive stronger borrower interest.


Underperforming Asset
This asset is priced 8-15% below comparable buildings within 200m. The gap is micro-location specific.
Realign frontage toward the dominant demand corridor. Nearby properties with stronger frontage and flow alignment are leasing faster. 8-15% pricing potential upside.

Storm Damages
Storm impact is projected to disrupt 12 to 25% of nearby road capacity, with low elevation segments and poor drainage driving blockage risk.
Reinforce vulnerable road segments, improve drainage in high risk zones, and secure alternative routes to maintain network continuity.

Drive NOI growth by identifying hidden revenue opportunities, and acting early on underperforming assets

Poor Condition
Physical condition lags peers (roof leaks). Upgraded assets achieve 18–25% higher retention → risk of 12–20% lower renewals and rising capex.
The asset underperforms upgraded buildings within 300 m (rents are 12–20% higher). Outdated layouts limit returns; targeted upgrades can add 10–18% NOI.

Where can I unlock the most NOI growth for this property?
Standardize spatial intelligence across portfolios to detect hidden risks, validate assumptions, and act ahead of value shifts.
Value Potential
Office demand is fragmenting within submarkets, not declining uniformly. Buildings within 300m of mixed-use nodes are holding foot traffic while adjacent assets are quietly losing it.
Tenant renewal probability drops 22% in buildings outside high-amenity clusters. Operating costs are rising faster in isolated assets.

Where will value shift next across my portfolio?
Anticipate loan demand shifts, price risk accurately, and allocate capital where collateral strength is improving.


Flood-exposed assets
Insurance costs up 15–25% within 12–24 months. Low-elevation assets face 12–20% higher value volatility and refinancing pressure.

Mortgage demand up 10–18% near growing residential density and redevelopment zones. Higher elevation and stable infrastructure drive stronger borrower interest.

Where will mortgage demand decrease next?
Standardize spatial intelligence across portfolios to detect hidden risks, validate assumptions, and act ahead of value shifts.

Underperforming Asset
This asset is priced 8-15% below comparable buildings within 200m. The gap is micro-location specific.
Realign frontage toward the dominant demand corridor. Nearby properties with stronger frontage and flow alignment are leasing faster. 8-15% pricing potential upside.

Where is pricing misaligned and how to reposition it?
Plan infrastructure investments, reduce disaster risk, and prioritize interventions where impact is highest.
Storm Damages
Storm impact is projected to disrupt 12 to 25% of nearby road capacity, with low elevation segments and poor drainage driving blockage risk.
Reinforce vulnerable road segments, improve drainage in high risk zones, and secure alternative routes to maintain network continuity.


Which roads are storm-risk and need action?


